DDG
Delta Delta G (DDG) is a metric for predicting how a single point mutation will affect protein stability. DDG, often referred to as 𝚫𝚫G, is the change in the change in Gibbs free energy (double changes intended). DDG is a measure of the change in energy between the folded and unfolded states (𝚫Gfolding) and the change in 𝚫Gfolding when a point mutation is present. This has been found to be an excellent predictor of whether a point mutation will be favorable in terms of protein stability.

The DDG tool uses the Rosetta DDG calculation, which has a strong correlation to experimentally calculated 𝚫𝚫G. This method was tested using 1,210 mutations and had a correlation of r = 0.73. While Rosetta Energy Units (REUs) are not directly convertible to kcal/mol, a conversion factor has been determined that can be used for approximation. The DDG protocol has been shown to be the most predictive of the Rosetta protocols.
For more information:
Kellogg EH, Leaver-Fay A, Baker D. Role of conformational sampling in computing mutation-induced changes in protein structure and stability.. Proteins. 2011 Mar;79(3):830-8.
A DEEPER LOOK AT DDG FOR PROTEINS
As a reminder, Gibbs free energy (G) = Enthalpy (H) – Temperature (T) x Entropy (S).
H is the internal energy of a protein. H decreases during protein folding because folding will cause packing of hydrophobic residues, optimization of polar group orientation, and achieve a good proximity to ideal bond lengths and angles.
S is the measure of order within a system. S of a protein becomes lower during protein folding because residue dynamics will be significantly decreased in comparison to the unfolded state. However, decrease in protein S will also cause an increase in S for solvent.
𝚫Gfolding = (Hunfolded – Hfolded) – T(Sunfolded – Sfolded)
𝚫Gmutation = (𝚫Gfolding)WT – (𝚫Gfolding)Mutant
The energy of an unfolded protein is nearly identical with a single point mutation. So, the dominant factor in DDG is the energy difference of the folded state.

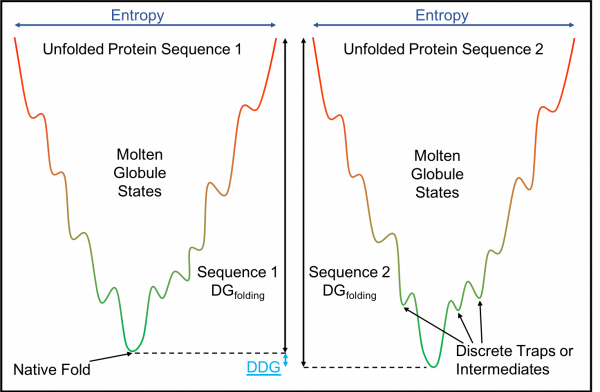
The diagram above is a simplified 2D energy landscape. The x axis represents different conformations of the protein. Energy of a protein structure is measured along the y axis. The unfolded states have the highest energy. In a 3D version, the many conformations that a protein can achieve are on x/z axis, so this translates to the Entropy of a protein at an energetic state.
Paths that follow the line down towards the global minimum represent conformational changes that occur during folding. The local minima represent discrete traps or intermediate structures. Proteins must then jump the energetic hurdle to continue down the line in order to find the global minimum. In this example, sequence two reaches a lower minimum so it is more stable.
DDG CALCULATION
The program takes a structure and runs an optimization to sample nearby conformations. Each optimization starts by repacking the side chains, then does a gradient-based minimization three times. The first time uses the repulsion term weighted at 10%, then 33%, then 100%, which allows more sampling in order to move through unfavorable transition states to find a lower minimum. Minor backbone changes are allowed during optimization. After 50 repeats using the same original structure, it takes the average score of the best three structures.
The Rosetta App used is ddg_monomer, which uses ddGMover.
For instructions on how to run DDG please follow this tutorial.